
Contents
In marketing, traffic refers to the total number of visits to a website over a given period. More visitors might seem better for business, right? Not exactly. Entrepreneurs may invest both time and money in driving traffic, but this does not always result in increased sales.
The thing is, traffic doesn’t automatically equal customers. Visitors need to take action, such as calling, filling out forms, or making a purchase. But only the right audience is willing to do that. Traffic must be high quality. Take Steve, for example: he’s a local plumber. There’s no way he’s buying a Prada handbag. He is just a one-time visitor, and it’s highly unlikely that he will convert.
Attracting the right people means regularly evaluating the quality of your website traffic. This means learning more about your website visitors, making sure you have the right tools, and always improving your site so that it turns visitors into sales.
Tools for Traffic Analysis
You can’t evaluate traffic just by looking at it, as you’ll need analytics tools. These help you understand your audience: their gender, age, where they’re coming from, and their interests.
- Google Analytics: Analyzes traffic, conversions, and user behavior. The “Traffic Sources” report shows which channels bring in the most visitors.
- Hotjar: Visualizes user actions through heatmaps and session recordings, and identifies problem areas on pages.
- SimilarWeb: Shows the largest websites in your industry and their share of overall industry traffic. It also analyzes competitors and their audiences. The paid traffic report helps evaluate ad effectiveness.
They decided to investigate further and ran the site through various tools. Hotjar revealed that the problem was with the payment form — it was too complicated. Customers were required to create an account to complete their purchase and even had to provide their postal code, which didn’t make sense. The team streamlined the form by removing unnecessary steps, and within a week, they increased their conversion rate by 15%.
Metrics for Analyzing Traffic Quality
Just like in a physical store, there are different types of visitors online. Some come in, glance around, and leave quickly. Others wander around, examining every shelf, but leave empty-handed after half an hour. The best customers are the ones who quickly make a purchase and keep coming back.
In a store, a security guard is keeping an eye on things. He can tell where the visitors came from, where they went, how long they spent browsing, and what they bought. On a website, these insights, or metrics, can be collected through the traffic analysis tools we’ve already mentioned. There are three main types of metrics: quantitative, behavioral, and conversion. Let’s take a look at how each one can benefit your business.
Quantitative Metrics
Quantitative metrics are like security cameras in a store: they track who came in and how long they stayed. On a website, they primarily show the number of visits and unique users. These numbers are the foundation of traffic analysis.
Traffic is the total number of visits to a site over a selected period.
If it’s growing — great! That means users are showing interest. But if out of a thousand visitors only two end up making a purchase, it’s time to investigate. Often, this is due to poorly configured ads, but sometimes the issue lies with the product itself or poor website usability.
Unique Visitors (Uniques) refer to the actual number of users who visited the page within a given period.
If most of your traffic comes from returning visitors, that’s not necessarily a good thing. While it shows stability, it can also indicate a lack of growth.
It’s better when the number of unique users is growing. This means your strategy for attracting new customers is working. New visitors are especially valuable for a growing business. They help the company define its target audience.
If one person returns to the site five times, analytics will count them as one unique user with five visits. A visit is another indicator of visitor loyalty. It’s any activity from a person on the site within a 30-minute window (by default). More visits than unique users? Great, that means the page is engaging.
For example, Maria visited an online store to choose a perfume for her sister. Half an hour later, her friend invited her over, and Maria left without turning off her laptop. Analytics detected that she was no longer active and ended the visit. Two hours later, Maria returned to her laptop and continued browsing. The system counted this as a new visit.
Result: one unique user and two visits.
Behavioral Metrics
We’ve learned about the number of visitors to the site, but now we need to understand how long they stayed, when they left, and how many pages they viewed. This is where behavioral metrics analysis comes in.
Bounce Rate is the percentage of users who leave the site after viewing just one page.
Imagine you walk into a store, see empty shelves, and immediately turn around. That’s a bounce. Calculating it is easy:
For example, if 1,000 people visit the site, but 600 of them leave right away without viewing other pages, the bounce rate will be 60%.
This metric is important for the following reasons:
- A low bounce rate is great. It means users find the site interesting and continue to engage with it.
- A high bounce rate can indicate irrelevant content, slow loading times, or a poor user interface.
- However, a high bounce rate isn’t always bad. If a user is looking for contact details or a quick answer, they may not need to explore other parts of the site. In the case of single-page landing pages, there’s often nowhere else to go. The key is that the visitor completes the desired action.
Page Depth is a metric that shows how many pages a user views on the site.
It’s bad if visitors only view one page and leave immediately. This could be due to complicated navigation, boring content, or slow page loading.
Another important metric is Time on Site. Short session durations aren’t always a red flag. For a food delivery service, short sessions are common since users quickly find what they want and place their orders. But for a blog or an online store, it’s not ideal — people come but don’t stay. This usually means the content isn’t engaging enough, or the products are hard to find.
Conversion Metrics
Let’s explain how conversion metrics work by looking at a real-life example. A city’s annual festival takes place every summer. The media published a full schedule of events, concerts and workshops. The advertising worked, and the event attracted not only locals but also visitors from other cities. It turns out the organizers managed to generate significant traffic. Now, entrepreneurs can capitalize on this.
The workshops now require a fee, food stalls charge for meals, and a carousel ride costs $5. By paying for something, a person takes a desired action and becomes a “customer” of the business.
Now, let’s see how this relates to internet marketing.
Conversion is the percentage of users who take a desired action. This could be making a purchase, submitting a form, or subscribing to a service. After completing the action, they become customers.
In an online store, a conversion would be a completed order, and for an educational platform, it could be a paid subscription for new videos.

Conversion Rate (CR) is calculated using the following formula:
Let’s say 1,000 people visited the site, and 50 of them completed an order. The conversion rate would be (50 / 1000) × 100% = 5%.
Why is this important?
The higher the conversion rate, the more successful your strategy is. If the numbers are low, it’s time to investigate the problem. Perhaps the order form is too complicated, or the products aren’t catching users’ attention.
Cost Per Conversion (CPA)
However, just knowing the number of conversions isn’t enough. You also need to understand the cost of conversion (CPA, Cost Per Action). This tells you how much it costs to acquire a customer who completes a desired action:
For example, if you spent $400 on advertising and attracted 100 customers, the cost per conversion would be:
Why does this matter?
The cost per conversion helps you understand which advertising channels are most cost-effective for your business: they bring in more customers for less money. For example, conversions from social media might be relatively inexpensive, while paid search ads require higher investments.
Form submissions
The form on your website is another effective conversion element. Marketers use it to guide the user towards completing a desired action. The form can be simple (e.g. a request for a callback) or more complex (e.g. registration for a webinar). The simpler and clearer the form, the higher the chances that it will be completed.
How to know if your form is working?
Apply the conversion rate formula (CR) and compare the total number of visitors with the number of conversions. For example, if only 10 out of 500 visitors submit the form, the CR will be 5% — that’s a bit low. How can you improve this? You could check the heatmap, run A/B testing, or temporarily replace the form. This way, you’ll gather more data and understand at which stage users are dropping off.
Other conversions
Conversions aren’t just about purchases or form submissions. The type of conversion depends on the current goal of the business. For an educational platform looking to increase sales, a conversion might be the number of visitors who purchased a course on a landing page. A chain of beauty salons aiming to boost direct marketing will measure conversion based on the number of people who downloaded a skincare guide. In exchange, they’ll collect email addresses.
Audience Analysis
Now, you need to understand who’s visiting your site: students, entrepreneurs, or artists. How old are they, where do they live, and what devices are they using to browse your site? Audience analysis helps you tailor your website and value proposition (UVP) to the actual needs of your users.
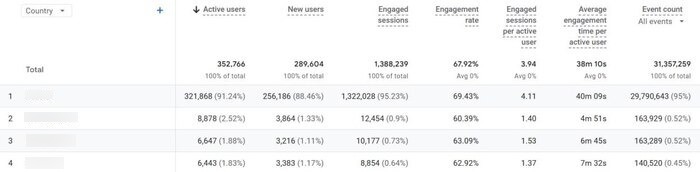
User location
Traffic geography helps you understand where your customers are coming from. This is especially important for local businesses, such as restaurants, gyms, service centers, and boutiques. If most of your flower shop’s audience is from a specific city, you should consider adding local promotions and adapting delivery terms. If your website selling merchandise from musicians has visitors from other countries, translate the content into English and add international payment options.
Geography analysis allows you to plan your marketing strategies more accurately and expand your audience to regions where it will bring the most profit.
Tip: Go to Google Analytics and check the “Geo” report. It will show you key regions and their potential.
Socio-demographic characteristics
Learn the age, gender, and interests of your website visitors. Then personalise content and improve targeted advertising. For example, if you sell toys and products for children, you need to consider the age range. Metrics show that your site is most often visited by women aged 23-35. You can target them with ads, for example on Facebook or Instagram, and increase your conversion rate by analysing the leads.
Also, don’t forget about the blog on your site. SEO articles can help improve behavioral factors, attract informational traffic, and, with the right strategy, lead to conversions into sales. Internal links to product pages or order forms embedded in the text work particularly well: they gently guide the user to the next step.

New and returning visitors
Another report you can check in Google Analytics is the “New vs. Returning Visitors” report. New visitors indicate how well your advertising is performing. Returning customers help maintain steady growth and bring in consistent sales.
It’s important to strike a balance between these two types of visitors. If new visitors aren’t coming in, the site loses its growth potential. If a regular customer stops visiting your site after two months of consistent purchases, they’ve likely switched to a competitor. How can you keep both groups?
You can attract new users with promotions on popular products and bring back old ones with loyalty programs or exclusive discounts for repeat customers.
Device types
Today, over 60% of users access the internet via mobile devices. If your site doesn’t display properly on a smartphone, the customer will leave without completing the desired action.
Keep usability in mind and check which devices are bringing you the most traffic so you don’t end up with issues like the screenshot above. If mobile traffic leads the way, make sure your site is optimized for smaller screens.
Traffic Sources
Imagine you visited a dentist and got braces for your child. After the appointment, the receptionist asks you to share your thoughts and fill out a survey. At the end, you see a question: “How did you hear about us?” Many people skip it, but they shouldn’t. It’s one of the most important questions on the entire form. By analyzing the answers, the team learns which channels are bringing the most traffic.
The same goes for websites. Some find you through a search engine, others click on ads, and some might come via a link from a friend. Fortunately, you don’t need to manually count the results. Traffic analysis tools will do all the work for you.
Organic SEO Traffic
Visitors can come from various sources: organic traffic, direct visits, advertising campaigns, social media, and messaging apps.
Organic traffic refers to users who find your site through search engines like Google. They don’t click on ads; instead, they select your site from the search results.
Users from search engines are a valuable source of traffic. The audience is already interested in the product, so you just need to nudge them toward making a purchase. But for your site to appear in search results, it needs to be optimized for SEO: proper keyword strategy, useful content, fast loading times, and a user-friendly structure.
Direct Traffic
Direct traffic refers to visitors who type the website URL directly into the browser, click on a bookmark, or follow a link in a document.
These users are often already familiar with your brand: they’ve seen your ads, heard about you, or have made purchases before. Selling products or services to them is easier because they are already familiar with what you offer. A high level of direct traffic indicates strong brand trust. You can be proud of that.
Paid Traffic
Paid traffic refers to visitors who come to your site from paid sources: search ads, targeted advertising, and banners.
This is a fast but costly way to attract a targeted audience. You can run ads through Google Ads and social media platforms.
Social Media
Traffic from social media is especially important for brands that focus on visual content.
On social media, it’s vital to consistently share engaging and useful content along with links to your website. You can also create paid promotions on these platforms.
Messengers
Messengers such as WhatsApp and Facebook Messenger are popular tools for direct communication with customers. Use them to gather traffic by sending targeted messages to your existing customer base. Avoid spamming: it will harm your brand’s reputation and even lead to customers blocking you permanently.
While not as widespread as email marketing, messaging apps are becoming an increasingly valuable channel for customer engagement, particularly for providing support or delivering personalized offers.
How to Improve Traffic Metrics
You’ve approached the task seriously:
- Created accounts in Google Analytics, Hotjar, and SimilarWeb.
- Gathered all the traffic data.
- Analyzed where your visitors come from, who they are, and how they behave on your site.
Great job! Now comes the most important part: improving key metrics. Here are some recommendations to help you perfect your promotion strategy.
Conversion Metrics
- Speed up page loading. No one likes to wait: 40% of users leave a site if it takes longer than 3 seconds to load. Your goal is to reduce the loading time to 0-2 seconds.
- Make content useful. If you delegate article writing to AI and don’t have it edited, the quality of the content will suffer. Poorly written text will be noticed not only by readers but also by search engines, which will lower your site’s ranking.
- Optimize navigation. People want to get the information they need in seconds, not wander through website sections. Show respect for your users and invest in creating a user-friendly interface.
- Work on your CTA buttons. Bright buttons with clear text, like “Buy” or “Schedule a Consultation,” guide visitors and increase click-through rates.
Engagement Metrics
- Add multimedia. Video reviews, GIFs, widgets, and high-quality photos (but not stock images!) capture attention and help increase time on site. A step-by-step guide with photos will undoubtedly engage readers more than a block of text.
- Simplify the text. Write concisely and clearly. People want to find information quickly, not decipher complex language.
- Use internal linking. Add links to other pages on your site. Users will begin exploring available materials and product pages, increasing page depth.
Quantitative Metrics
- Invest in SEO. Build a solid keyword strategy, then optimize your pages and content for popular search queries.
- Run advertising campaigns. Pay-per-click ads on Google or social media targeting can help attract more traffic. Publish interesting content and guide people to your site.
- Attract traffic from various sources. For example, through messengers, partner websites, or email newsletters.
Behavioral Metrics
- Check if the content matches user intent. If someone searches for “sushi delivery” but lands on a recipe page, they’ll leave.
- Optimize the mobile version. Over 60% of traffic comes from mobile devices. If the site is difficult to navigate on a phone, users will leave.
- Fix technical issues. Broken links, slow loading times, or a confusing interface will drive users away.
Evaluating traffic quality is the foundation for your business growth. By analyzing sources, conversion metrics, engagement, and user behavior, you can improve your site and attract the right audience.
Don’t chase the number of visitors. Even a thousand visitors mean little if they aren’t completing the desired actions. It’s much more important that each user finds what they need: fills out a form, places an order, or comes back again. Your goal is to identify weak points, test hypotheses, and adjust your strategy accordingly.
Key Takeaways from This Article
- Traffic analysis helps you understand how well your visitors align with your business goals.
- Website optimization improves conversions, reduces bounce rates, and boosts audience loyalty.
- Working on content, page speed, and navigation is crucial for successful promotion.
- Traffic sources include organic search, paid ads, social media, and messengers.
- Tools like Google Analytics, Hotjar, SimilarWeb, and others help collect data, identify weak points, and fix them.
Promotion takes time and effort. If you feel confused by metrics or don’t know where to start, the team at Why SEO Serious is always ready to help. We’ll conduct a thorough website analysis and provide actionable solutions.